


Mobile video exceeded 50 percent of global internet trafficfor the first time in 2011 according to the latest The Cisco® Visual Networking Index (VNI) Global Mobile Data Traffic Forecast Update. Global mobile data traffic grew 2.3-fold in 2011, more than doubling for the fourth year in a row. The 2011 mobile data traffic growth rate was higher than anticipated. Last year's forecast projected that the growth rate would be 131 percent. This year's estimate is that global mobile data traffic grew 133 percent in 2011. Among its findings include:
Global mobile data traffic grew 2.3-fold in 2011, more than doubling for the fourth year in a row. The 2011 mobile data traffic growth rate was higher than anticipated. Last year's forecast projected that the growth rate would be 131 percent. This year's estimate is that global mobile data traffic grew 133 percent in 2011.
Last year's mobile data traffic was eight times the size of the entire global Internet in 2000. Global mobile data traffic in 2011 (597 petabytes per month) was over eight times greater than the total global Internet traffic in 2000 (75 petabytes per month).
Mobile video traffic exceeded 50 percent for the first time in 2011. Mobile video traffic was 52 percent of traffic by the end of 2011.
Mobile network connection speeds grew 66 percent in 2011. Globally, the average mobile network downstream speed in 2011 was 315 kilobits per second (kbps), up from 189 kbps in 2010. The average mobile network connection speed for smartphones in 2011 was 1344 kbps, up from 968 kbps in 2010.
In 2011, a fourth-generation (4G) connection generated 28 times more traffic on average than a non-4G connection. Although 4G connections represent only 0.2 percent of mobile connections today, they already account for 6 percent of mobile data traffic.
The top 1 percent of mobile data subscribers generate 24 percent of mobile data traffic, down from 35 percent 1 year ago. According to a mobile data usage study conducted by Cisco, mobile data traffic has evened out over the last year and now approaches the 1:20 ratio that has been true of fixed networks for several years.
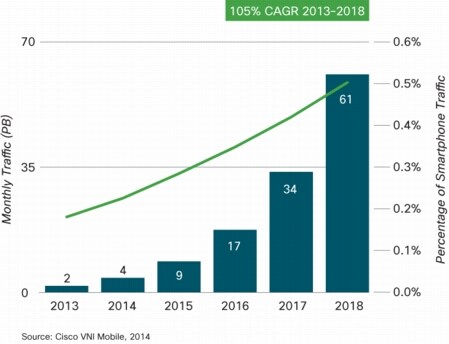
Average smartphone usage nearly tripled in 2011. The average amount of traffic per smartphone in 2011 was 150 MB per month, up from 55 MB per month in 2010.
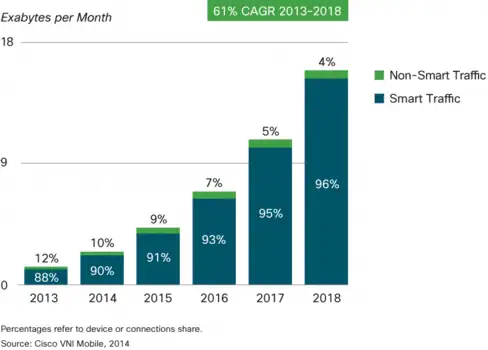
Smartphones represent only 12 percent of total global handsets in use today, but they represent over 82 percent of total global handset traffic. In 2011, the typical smartphone generated 35 times more mobile data traffic (150 MB per month) than the typical basic-feature cell phone (which generated only 4.3 MB per month of mobile data traffic).
Globally, 33 percent of handset and tablet traffic was offloaded onto the fixed network through dual-mode or femtocell in 2011. In 2011, 72 petabytes of smartphone and tablet traffic were offloaded onto the fixed network each month. Without offload, traffic originating from phones and tablets would have been 217 petabytes per month rather than 147 petabytes per month in 2011.
Android is now higher than iPhone levels of data use. Toward the end of 2011, Android consumption was equal to iPhone consumption, if not higher, in the United States and Western Europe.
In 2011, 10 percent of mobile devices were potentially IPv6-capable. This estimate is based on network connection speed and OS capability.
In 2011, the number of mobile-connected tablets tripled to 34 million, and each tablet generated 3.4 times more traffic than the average smartphone. In 2011, mobile data traffic per tablet was 517 MB per month, compared to 150 MB per month per smartphone.
There were 175 million laptops on the mobile network in 2011, and each laptop generated 22 times more traffic than the average smartphone. Mobile data traffic per laptop was 2.1 GB per month, up 46 percent from 1.5 GB per month in 2010.
Nonsmartphone usage increased 2.3-fold to 4.3 MB per month in 2011, compared to 1.9 MB per month in 2010. Basic handsets still make up the vast majority of devices on the network (88 percent).
The Mobile Network Through 2016
Mobile data traffic will reach the following milestones within the next five years.
• Monthly global mobile data traffic will surpass 10 exabytes in 2016.
• Over 100 million smartphone users will belong to the "gigabyte club" (over 1 GB per month) by 2012.
• The number of mobile-connected devices will exceed the world's population in 2012.
• The average mobile connection speed will surpass 1 Mbps in 2014.
• Due to increased usage on smartphones, handsets will exceed 50 percent of mobile data traffic in 2014.
• Monthly global mobile data traffic will surpass 10 exabytes in 2016.
• Monthly mobile tablet traffic will surpass 1 exabyte per month in 2016.
• Tablets will exceed 10 percent of global mobile data traffic in 2016.
• China will exceed 10 percent of global mobile data traffic in 2016.
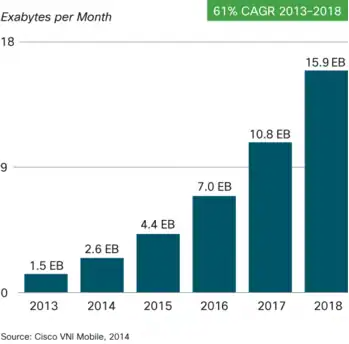
Global mobile data traffic will increase 18-fold between 2011 and 2016. Mobile data traffic will grow at a compound annual growth rate (CAGR) of 78 percent from 2011 to 2016, reaching 10.8 exabytes per month by 2016.
By the end of 2012, the number of mobile-connected devices will exceed the number of people on earth, and by 2016 there will be 1.4 mobile devices per capita. There will be over 10 billion mobile-connected devices in 2016, including machine-to-machine (M2M) modules-exceeding the world's population at that time (7.3 billion).
Mobile network connection speeds will increase 9-fold by 2016. The average mobile network connection speed (189 kbps in 2011) will exceed 2.9 megabits per second (Mbps) in 2016.
In 2016, 4G will be 6 percent of connections, but 36 percent of total traffic. In 2016, a 4G connection will generate 9 times more traffic on average than a non-4G connection.
By 2016, 39 percent of all global mobile devices could potentially be capable of connecting to an IPv6 mobile network. Over 4 billion devices will be IPv6-capable in 2016.
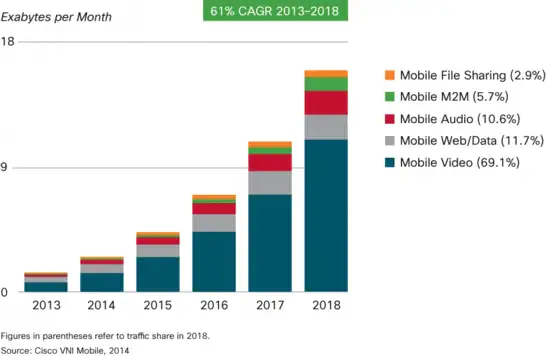
Two-thirds of the world's mobile data traffic will be video by 2016. Mobile video will increase 25-fold between 2011 and 2016, accounting for over 70 percent of total mobile data traffic by the end of the forecast period.
Mobile-connected tablets will generate almost as much traffic in 2016 as the entire global mobile network in 2012. The amount of mobile data traffic generated by tablets in 2016 (1.1 exabytes per month) will be approximately equal to the total amount of global mobile data traffic in 2012 (1.3 exabytes per month).
The average smartphone will generate 2.6 GB of traffic per month in 2016, a 17-fold increase over the 2011 average of 150 MB per month. Aggregate smartphone traffic in 2016 will be 50 times greater than it is today, with a CAGR of 119 percent.
By 2016, over 3.1 exabytes of mobile data traffic will be offloaded to the fixed network by means of dual-mode devices and femtocells each month. Without dual-mode and femtocell offload of handset and tablet traffic, total mobile data traffic would grow at a CAGR of 84 percent between 2011 and 2016 (21-fold growth), instead of the projected CAGR of 78 percent (18-fold growth).
The Middle East and Africa will have the strongest mobile data traffic growth of any region at 104 percent CAGR. This region will be followed by Asia Pacific at 84 percent and Central and Eastern Europe at 83 percent.
China will account for over 10 percent of global mobile data traffic in 2016, up from less than 5 percent in 2011.
Appendix A summarizes the details and methodology of the VNI forecast.
2011 Year in Review and Outlook for 2012
Mobile Data Traffic More Than Doubled in 2011
Global mobile data traffic more than doubled (2.3-fold growth, or 133 percent increase) in 2011, for the fourth year in a row. It is a testament to the momentum of the mobile industry that this growth persisted despite global economic uncertainties, the broad implementation of tiered mobile data packages, and an increase in the amount of mobile traffic offloaded to the fixed network.
Mobile Data Traffic Will Double Again in 2012
Cisco estimates that traffic in 2012 will grow 2.1-fold (110 percent), reflecting a continuation in the tapering of growth rates. The evolving device mix and the migration of traffic from the fixed network to the mobile network have the potential to bring the growth rate higher, while tiered pricing and traffic offload may reduce this effect. The current growth rates of mobile data traffic resemble those of the fixed network from 1997 through 2001, when the average yearly growth was 150 percent (Table 1). In the case of the fixed network, the growth rate remained in the range of 150 percent for 5 years.
Figure 1. Cisco Forecasts 10.8 Exabytes per Month of Mobile Data Traffic by 2016
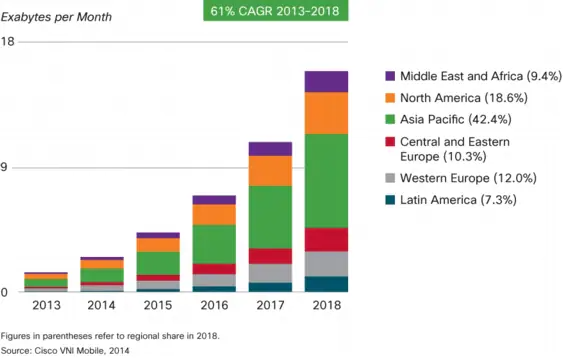
The Asia Pacific and Western Europe regions will account for over half of global mobile traffic by 2016, as shown in Figure 2. Middle East and Africa will experience the highest CAGR of 104 percent, increasing 36-fold over the forecast period. Asia Pacific (a region that now includes Japan) will have the second highest CAGR of 84 percent, increasing 21-fold over the forecast period. The emerging market regions of Central and Eastern Europe and Latin America will have CAGRs of 83 percent and 79 percent respectively, and combined with Middle East and Africa will represent an increasing share of total mobile data traffic, up from 15 percent at the end of 2011 to 19 percent by 2016.
Figure 2. Global Mobile Data Traffic Forecast by Region
In the sections that follow, we identify 10 major trends behind the growth of mobile data traffic.
Trend 1: Device Diversification
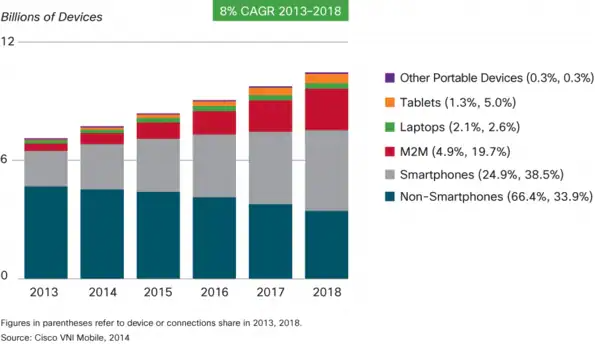
Figure 3 shows the devices responsible for mobile data traffic growth. Laptops and netbooks will continue to generate a disproportionate amount of traffic, but newer device categories such as tablets and M2M nodes will begin to account for a more significant portion of the traffic by 2016.
Figure 3. Laptops and Smartphones Lead Traffic Growth
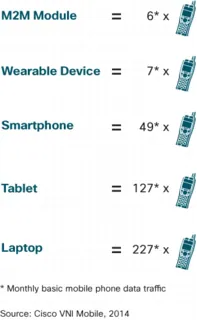
The proliferation of high-end handsets, tablets, and laptops on mobile networks is a major generator of traffic, because these devices offer the consumer content and applications not supported by previous generations of mobile devices. As shown in Figure 4, a single smartphone can generate as much traffic as 35 basic-feature phones; a tablet as much traffic as much as 121 basic-feature phones; and a single laptop can generate as much traffic as 498 basic-feature phones.
Figure 4. High-End Devices Significantly Multiply Traffic
By 2016, one-quarter of mobile users will have more than one mobile-connected device, and 9 percent will have three or more mobile-connected devices (Figure 5). Today, mobile users generally need to purchase separate mobile data subscriptions for each device, but the increase in multiple mobile device ownership is leading mobile operators to consider more holistic packages that can accommodate multiple devices.
Figure 5. One-Quarter of Mobile Users Will Own Two or More Mobile-Connected Devices by 2016
Trend 2: Growth in Average Traffic per Device
Average traffic per device is expected to increase rapidly during the forecast period.The following are a few of the main promoters of growth in average usage.
• As mobile network connection speeds increase, the average bit rate of content accessed through the mobile network will increase. High-definition video will be more prevalent, and the proportion of streamed content as compared to side-loaded content is also expected to increase with average mobile network connection speed.
• The shift toward on-demand video will affect mobile networks as much as it will affect fixed networks. Traffic can increase dramatically even while the total amount of time spent watching video remains relatively constant.
• As mobile network capacity improves and the number of multiple-device users grows, operators are more likely to offer mobile broadband packages comparable in price and speed to those of fixed broadband. This is encouraging mobile broadband substitution for fixed broadband, where the usage profile is substantially higher than average.
• Mobile devices increase an individual's contact time with the network, and it is likely that this increased contact time will lead to an increase in overall minutes of use per user. However, not all of the increase in mobile data traffic can be attributed to traffic migration to the mobile network from the fixed network. Many uniquely mobile applications continue to emerge, such as location-based services, mobile-only games, and mobile commerce applications.
Trend 3: Mobile Video
Because mobile video content has much higher bit rates than other mobile content types, mobile video will generate much of the mobile traffic growth through 2016. Mobile video will grow at a CAGR of 90 percent between 2011 and 2016, the highest growth rate of any mobile application category that we forecast. Of the 10.8 exabytes per month crossing the mobile network by 2016, 7.6 exabytes will be due to video (Figure 6).
Figure 6. Mobile Video Will Generate Over 70 Percent of Mobile Data Traffic by 2016
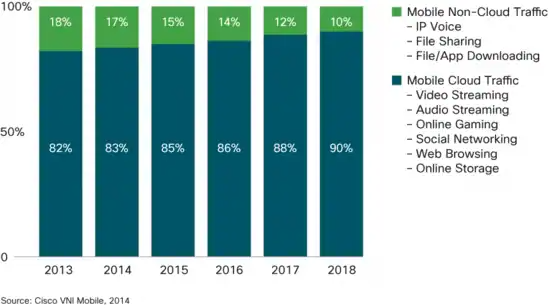
Trend 4: Mobile Cloud Adoption
Mobile devices have memory and speed limitations that might prevent them from acting as media consumption devices, were it not for cloud applications and services. Cloud applications and services such as Netflix, YouTube, Pandora, and Spotify allow mobile users to overcome the memory capacity and processing power limitations of mobile devices. A user with an 8 GB smartphone who streams cloud video and music will consume more content over the course of 2 years than can be stored on the device itself. A smartphone user adopting Netflix, Pandora, and Facebook will generate more than twice the volume of traffic generated by a smartphone user adopting only email and web applications (Figure 7).
Figure 7. Cloud Media Applications Multiply Smartphone Traffic
Because many Internet video applications can be categorized as cloud applications, mobile cloud traffic follows a curve similar to video. Globally, cloud applications will account for 71 percent (7.6 exabytes per month) of total mobile data traffic in 2016, compared to 45 percent (269 petabytes per month) at the end of 2011. Mobile cloud traffic will grow 28-fold from 2011 to 2016, a compound annual growth rate of 95 percent.
Trend 5: Traffic Offload from Mobile Networks to Fixed Networks
Much mobile data activity takes place within the user's home. For users with fixed broadband and Wi-Fi access points at home, or for users served by operator-owned femtocells and picocells, a sizable proportion of traffic generated by mobile and portable devices is offloaded from the mobile network onto the fixed network.
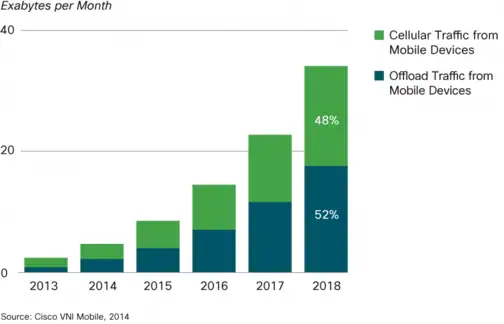
As a percentage of total mobile data traffic from all mobile-connected devices, mobile offload increases from 11 percent (72 petabytes/month) in 2011 to 22 percent (3.1 exabytes/month) in 2016 (Figure 8). Without offload, Global mobile data traffic would grow at a CAGR of 84 percent instead of 78 percent. Offload volume is determined by smartphone penetration, dual-mode share of handsets, percentage of home-based mobile Internet use, and percentage of dual-mode smartphone owners with Wi Fi fixed Internet access at home.
Figure 8. 22 Percent of Total Mobile Data Traffic will be Offloaded in 2016
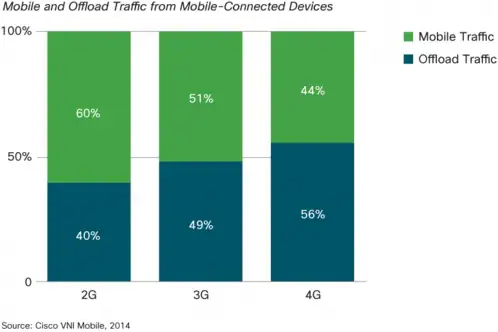
As a percentage of total mobile data traffic from handsets and tablets, mobile offload will be 31 percent (3.1 exabytes/month) in 2016, down slightly from 33 percent (72 petabytes/month) in 2011 (Figure 9). Total mobile data traffic from handsets and tablets will reach 6.9 exabytes/month by 2016, up from 145 petabytes/month in 2011. The percentage of traffic offloaded from tablets and handsets remains relatively flat over the forecast period. Although in developed regions the offload percentage steadily rises throughout the forecast period, this growth is offset by a decline in offload percentage in many developing countries and regions. The declining offload percentage in developing markets is due to an increasing number of mobile-only data user, and a decreasing number of mobile data users with Wi-Fi access at home.
Figure 9. 31 Percent of Handset and Tablet Traffic will be Offloaded in 2016
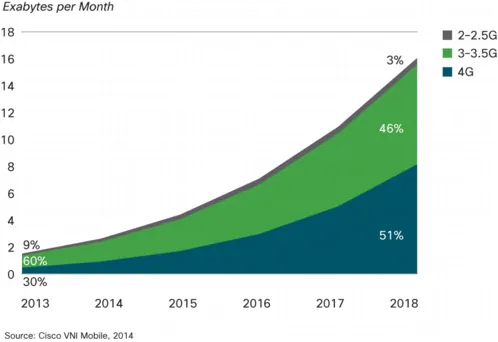
Trend 6: Mobile Network Connection Speeds to Increase 9-fold, with 4G Impact by 2016
Globally, the average mobile network connection speed in 2011 was 315 kbps. The average speed will grow at a compound annual growth rate of 56 percent, and will exceed 2.9 Mbps in 2016. Smartphone speeds, generally third-generation (3G) and higher, are currently over four times higher than the overall average. Smartphone speeds will quadruple by 2016, reaching 5.2 Mbps.
There is anecdotal evidence to support the idea that usage increases when speed increases, although there is often a delay between the increase in speed and the increased usage, which can range from a few months to several years. The Cisco VNI forecast relates application bit rates to the average speeds in each country. Many of the trends in the resulting traffic forecast can be seen in the speed forecast, such as the high growth rates for developing countries and regions relative to more developed areas (Table 4).
Current and historical speeds are based on data from Cisco's GiST (Global Internet Speed Test) application and Ookla's Speedtest. Forward projections for mobile data speeds are based on third-party forecasts for the relative proportions of 2G, 3G, 3.5G, and 4G among mobile connections through 2016. For more information about Cisco GIST, please visit http://ciscovni.com/gist/index.html.
A crucial factor promoting the increase in mobile speeds over the forecast period is the increasing proportion of 4G mobile connections. The impact of 4G connections on traffic is significant, because 4G connections, which include mobile WiMAX and Long-Term Evolution (LTE), generate a disproportionate amount of mobile data traffic. Although 4G connections represent only 0.2 percent of mobile connections today, they already account for 6 percent of mobile data traffic. In 2016, 4G will represent 6 percent of connections, but 36 percent of total traffic.
Currently, a 4G connection generates 28 times more traffic than a non-4G connection. There are two reasons for this. The first is that many of the 4G connections today are for residential broadband routers and laptops, which have a higher average usage. The second is that higher speeds encourage the adoption and usage of high-bandwidth applications, so that a smartphone on a 4G network is likely to generate 50 percent more traffic than the same model smartphone on a 3G or 3.5G network.
As smartphones come to represent a larger share of 4G connections, the gap between the average traffic of 4G devices and non-4G devices will narrow, but in 2016 a 4G connection will still generate 9 times more traffic than a non-4G connection.
Trend 7: The Impact of Tiered Pricing-Shake-Up at the Top
An increasing number of service providers worldwide are moving from unlimited data plans to tiered mobile data packages. To make an initial estimate of the impact of tiered pricing on traffic growth, we recently completed a case study based on the data of two Tier 1 Global service providers from mature mobile markets, encompassing the timeframe of the introduction of tiered pricing. The findings in this study are based on Cisco's analysis of data provided by a third-party data analysis firm. This firm maintains a panel of volunteer participants who have given the company access to their mobile service bills, including KB of data usage. The data in this study reflects usage associated with over 22,000 devices and spans 22 months. Cisco's analysis of the data consists of categorizing the pricing plans, operating systems, devices, and users; incorporating additional third-party information on device characteristics; and performing exploratory and statistical data analysis. While the results of the study represent actual data from Tier 1 mobile data operators, global forecasts that include emerging markets, and Tier 2 providers will lead to lower estimates.
Over the period of the nearly 2-year study, the percentage of tiered plans compared to all data plans increased from 4 percent to 29 percent, while unlimited plans dropped from 81 percent to 63 percent. This has not, however, constrained usage patterns. In a year's span, average usage per device on a tiered plan grew from 144.3 MB per month to 388 MB per month, a rate of 169 percent, while usage per device of unlimited plans grew at a slower rate of 83 percent from a higher base of 391 MB per month to 715 MB per month.
However, tiered plans are effective. While the number of tiered plans as well as the usage per tiered plan are increasing, the average usage of a connection on a tiered pricing plan is half that of unlimited plans. There is a narrowing of the bandwidth consumption gap between tiered and unlimited data plan connections, showing the general increase in consumption of mobile data traffic due to the increased consumption of services such as Pandora, YouTube, Facebook, and Netflix. Unlimited plans have promoted the adoption of mobile applications and increased web usage through mobile broadband. It is still uncertain whether tiered pricing, while supporting necessary network management, will lead to unabated adoption and usage of newer services that have led to the growth of mobile data traffic volumes.
Tiered pricing plans are often designed to constrain the heaviest mobile data users, especially the top 1 percent of mobile data consumers. An examination of heavy mobile data users reveals that the top 1 percent of mobile users is actually the top 5 percent, because the top 1 percent of users varies each month. For example, for a mobile data subscriber base of 1000 users; the top 1 percent is 10 users. However, the same set of 10 users does not appear in the top 1 percent category in each month; rather, a larger set of 50 subscribers rotates though the top 1 percent. This top 5 percent are the users who have the potential of being in the top 1 percent bracket in any given month and substitute for each other in subsequent months. The trend is due to the nature of consumption of mobile data applications.
The megabytes per month of an average top 1 percent of mobile data users have been steadily decreasing compared to overall usage. At the beginning of the 2-year study, 52 percent of the traffic was generated by the top 1 percent. At the end of the 22-month time frame, the top 1 percent generated 24 percent of the overall traffic per month (Figure 10). Similarly, the top 10 percent of the mobile data users generated 83 percent of the monthly traffic at the beginning of the study, but are now down to 54 percent.
Figure 10. Top 1 Percent Generates 24 Percent of Monthly Data Traffic in Month 21 Compared to 52 Percent in Month 1
Additional evidence that tiered pricing plans are effectively constraining the top 1 percent of mobile users, and that the growth is being made up by those outside the top 1 percent, is that the usage of the top 20 percent is growing much more rapidly than the top 1 percent (Figure 11).
Figure 11. Top 20 Percent Growing at a Faster Rate of 102 Percent Year-to-Year
The proportion of mobile users generating more than 2 gigabytes per month has increased significantly over the past year, reaching 3 percent of users towards the end of 2011 (Figure 12).
Figure 12. 1 Percent of Users Consume 5 GB per Month and 3 Percent Consume over 2 GB per Month
More detail on the tiered pricing case study is available in Appendix B.
Trend 8: Android Leads Apple in Data Usage
At the beginning of the tiered pricing case study, Apple operating systems' data consumption was equal to if not higher than other smartphone platforms. However, Android-based devices have now caught up and their data consumption is 29 percent higher than that of Apple devices in terms of megabytes per month per connection usage (Figure 13).
Figure 13. Megabytes per Month by Operating System
More detail on consumption by operating system is available in Appendix B.
Trend 9: The (Mobile) Internet of Things
Cellular communication between objects, machines, or sensors has led to the growth of M2M connections. These connections are in the form of smart metering, business and consumer surveillance, inventory management, fleet management, and healthcare modules, all of which are designed for operational excellence. M2M technologies are being used across a broad spectrum of industries. As real-time information monitoring is helping companies to deploy new video-based security systems and hospitals and helping healthcare professionals to remotely monitor the progress of their patients, bandwidth-intensive M2M connections become more prevalent. Traditional appliances and devices, such as home appliances, vehicles, energy meters, and vending machines-which traditionally have not been connected directly to cellular networks-are now entering the network.
High-bandwidth scenarios for M2M are becoming real in many categories, including the following.
• Business and consumer security and surveillance: Video streams such as commercial security cameras, nannycams, and petcams, accessed through mobile-enabled residential or commercial gateways, fall into this category.
• Health care: In the medical, well-being, and sports and fitness industries, devices and services used by medical personnel are being connected to reduce errors.
• Inventory and fleet management: Wi-Fi is being considered as an adjunct to cellular-based fleet management connectivity, to allow a vehicle to use cellular technology in the field, and support lower-cost, higher-speed Wi-Fi to download and upload data while in fleet headquarters and loading areas.
• Telematics: Trip assistance, navigation, and vehicle management are gaining greater consumer adoption, along with broadband-to-the-car offerings that use a cellular connection to the vehicle and then distribute the connection to notebook PCs and other devices within the vehicle through Wi-Fi.
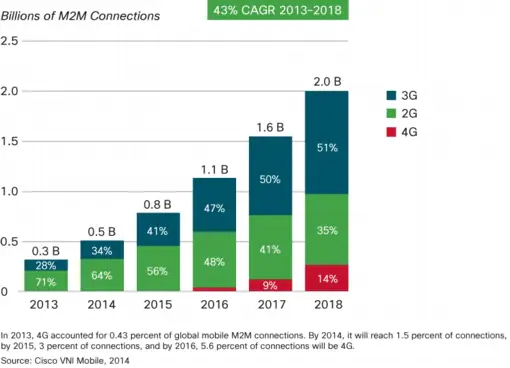
M2M capabilities similar to mobile devices are migrating from second-generation (2G) to 3G and 4G technologies. Globally, M2M traffic will grow 22-fold from 2011 to 2016, a compound annual growth rate of 86 percent, with M2M traffic reaching 508,022 terabytes per month in 2016. M2M will account for 5 percent of total mobile data traffic in 2016, compared to 4 percent at the end of 2011. The average M2M module will generate 266 megabytes of mobile data traffic per month in 2016, up from 71 megabytes per month in 2011 (Figure 14).
Figure 14. Machine-to-Machine Traffic to Increase 22-Fold Between 2011 and 2016
The Asia Pacific region will lead the M2M category in 2016 with 259.7 petabytes per month and a CAGR of 88 percent between 2011 and 2016. The Middle East and Africa region will experience the highest CAGR of 90 percent from 2011 to 2016 with 23 petabytes per month of M2M traffic in 2016.
Trend 10: IPv6-Capable Mobile Devices
The telecommunications industry is becoming increasingly aware of the pending depletion of IPv4 address space. Indeed, we are fast approaching the global exhaustion of IPv4 addresses, as signified by the Internet Assigned Numbers Authority (IANA) allocating its last central pool of available IPv4 addresses on February 3, 2011. In some regions, the effect of this has been immediate: Asia Pacific exhausted its IPv4 registry in April 2011, and the European registry is expected to be depleted in mid 2012.
Amid these developments, the Cisco VNI team has begun a preliminary analysis of IPv6-capable mobile devices. This is intended as a projection of the number of IPv6-capable mobile devices, not mobile devices with an IPv6 connection configured by the ISP, or IPv6 mobile data traffic.
In our initial findings, we have identified a notable potential for IPv6-capable mobile devices. Considering newer generation devices that are driving mobile network usage and data traffic growth, we forecast that 71% of smartphones and tablets (1.6B) could be IPv6 capable by 2016 (up from 38% or 240M smartphones and tablets in 2011). This is based on the projection that a high percentage of these devices will be capable via OS (Android iOS, Symbian, next-gen RIM, WindowsPhone) as well estimating the type of mobile network infrastructure the device is capable of connecting to (3.5G or higher).
Figure 15. Global IPv6-Capable Smartphones and Tablets Reach 1.6B by 2016
With a broader view of the mobile devices landscape, by 2016 we project that 39 percent of all global mobile devices could be IPv6-capable, up from 10% in 2011. While certain segments are likely not to enable IPv6 because of low-level application requirements (non-smartphone, for example), a segment such as high-speed connected laptops holds potential, as laptops generally have IPv6 enabled by default when connected to a mobile network infrastructure.
Figure 16. Global IPv6-Capable Mobile Devices Reach 4B by 2016
In terms of regions with the greatest propensity for newer generation IPv6-capable mobile devices, Asia Pacific leads throughout the forecast period, reaching 689 million in 2016. When combined with the Asia Pacific region IPv4 registry depletion, this indicates a particular confluence of supply and demand trends that may have a unique impact on IPv6 adoption in this region.
While this initial analysis is a measure of potential, it does not predict the point a user or ISP will actively enable IPv6 connectivity alongside or in place of IPv4 connectivity. However, leading indicators such as newer generation mobile devices, rich media applications and content availability suggest an environment increasingly ready for IPv6-based Internet communication of mobile devices on mobile networks.
The Cisco VNI team will continue its IPv6 analysis and will provide an update in the June 2012 Visual Networking Index, which includes both fixed and wireless devices and IP traffic.
Conclusion
Mobile data services are well on their way to becoming necessities for many network users. Mobile voice service is already considered a necessity by most, and mobile data, video, and TV services are fast becoming an essential part of consumers' lives. Used extensively by consumer as well as enterprise segments, with impressive uptakes in both developed and emerging markets, mobility has proven to be transformational. Mobile subscribers are growing rapidly and bandwidth demand due to data and video is increasing. Mobile M2M connections continue to increase. The next 5 years are projected to provide unabated mobile video adoption despite uncertain macroeconomic conditions in many parts of the world. Backhaul capacity must increase so mobile broadband, data access, and video services can effectively support consumer usage trends and keep mobile infrastructure costs in check.
Deploying next-generation mobile networks requires greater service portability and interoperability. With the proliferation of mobile and portable devices, there is an imminent need for networks to allow all these devices to be connected transparently, with the network providing high-performance computing and delivering enhanced real-time video and multimedia. This openness will broaden the range of applications and services that can be shared, creating a highly enhanced mobile broadband experience. The expansion of wireless presence will increase the number of consumers who access and rely on mobile networks, creating a need for greater economies of scale and lower cost per bit.
As many business models emerge with new forms of advertising, media and content partnerships, mobile services including M2M, live gaming, and (in the future) augmented reality, a mutually beneficial situation needs to be developed for service providers and over-the-top providers. New partnerships, ecosystems, and strategic consolidations are expected as mobile operators, content providers, application developers, and others seek to monetize the video traffic that traverses mobile networks. Operators must solve the challenge of effectively monetizing video traffic while increasing infrastructure capital expenditures. They must become more agile and able to quickly change course and provide innovative services to engage the Web 3.0 consumer. While the net neutrality regulatory process and business models of operators evolve, there is an unmet demand from consumers for the highest quality and speeds. As wireless technologies aim to provide experiences formerly only available through wired networks, the next few years will be critical for operators and service providers to plan future network deployments that will create a adaptable platform upon which will deploy the multitude of mobile-enabled devices and applications of the future.