Conviva’s State of Streaming TV Industry: Overall Viewership Up 72%, Rate of Consumption Rising Faster at 49%
Foster City, Calif., May 1, 2019 — Conviva, a research firm that specializes on the streaming entertainment industry, has concluded that while adoption of streaming is increasing, so is the complexity of achieving the goal of seamless video delivery at scale. In its "State of the Streaming TV Industry for First Quarter 2019," Conviva said that maintaining a high-quality viewer experience across content and advertising is critical as streaming TV providers look to increase viewer retention and monetization.
In addition, social media plays an increasingly important role for promotion and monetization, and as a distribution platform in its own right.
Some of the most revealing and surprising insights from Conviva’s analysis are as follows:
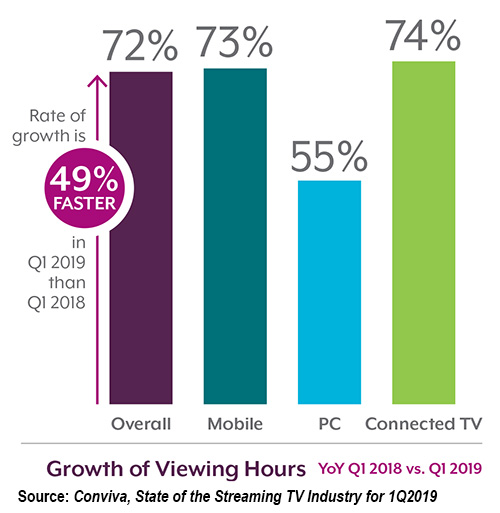
- Size and pace of growth are both increasing. Viewership overall is up 72% year-over-year, and the rate of consumption has increased, growing 49% faster in Q1 2019 than in Q1 2018.
- Content aggregators (virtual MVPDs) like DirecTV Now, Hulu, PlayStation Vue, and Sling saw viewership up 108% year-over-year as compared to 60% growth for other services in the United States.
- The battle for the TV screen is not over. Amazon Fire TV captured 18.6% share of viewership, up significantly from 11.4% share in Q1 2018 as it gains on Roku’s long-standing lead at 42.4% share.
- Amidst impressive growth, minimizing quality issues remains top of mind for the industry with buffering (when the video pauses during playback so it can reload) seeing the largest improvement, down 34% year-over-year.
- Up to 47% of streaming ads are failing. As more ad dollars shift to streaming, the cost and viewer engagement risks are huge. As another form of streaming content, the quality of the entire ad experience is paramount to success.
- Social media is a big opportunity for content distribution and monetization. Increasingly viewers are engaged
- in real-time for peak events like the Oscars, sports, and politics across multiple channels. Cross-channel visibility and promotion maximizes exposure and engagement for publishers.
- The highest peak concurrency in Q1 2019, the point at which the maximum number of viewers tune in all at once, came on January 8th UTC. This peak, which was 37.6% higher than the previous year’s Q1 peak, came as #2 Clemson bested #1 Alabama in the College Football Playoff National Championship.
Conviva is the real-time decisioning platform for optimized streaming entertainment. More than 250 industry leaders across 5 continents – including CBS, DAZN, HBO, Hulu, PlayStation™Vue, Sky, Sling TV, Turner, and Univision – rely on Conviva to maximize their consumer engagement, deliver the quality experiences viewers expect, and drive revenue growth. With a global footprint of 100 billion streams per year across 3 billion applications streaming on devices in 180 countries, Conviva offers streaming providers unmatched scale for continuous video measurement, intelligence, and benchmarking across every second of every stream on every screen.
Conviva’s data is collected using proprietary sensor technology, which is embedded directly within streaming video applications. Conviva analyzes a trillion real-time transactions per day. In this report, the year-over-year data from Q1 2019 as compared to Q1 2018 was normalized based on Conviva’s customer base.
For the first time, this report contains Conviva’s streaming advertising and social media insights. Data highlights new potential failure points which are critically important as ad dollars move to streaming. Also included are insights into viewer behavior and social platform performance for peak events that drive high-performing campaigns, as streaming TV providers increasingly use social media to engage customers through both short-form and full-length content distribution. These new sources of data provide a more complete view across the streaming TV ecosystem.
 According to Conviva, overall, streaming viewership was up 72.4% year-over-year in Q1 2019, consistent with past reports and trends we’ve been tracking for overall growth of the industry. Viewership is not only up year-over-year, but the rate of growth has increased, with viewing hours growing 49% faster in Q1 2019 than in Q1 2018. That doesn’t change the fact that the internet wasn’t built for video. As streaming TV viewership grows, and devices increase and fragment, the complexity of delivering this massive scale at linear TV quality has intensified.
Peak concurrency, the point at which the maximum number of viewers tune in all at once, also increased with the highest peak in Q1 2019 37.6% higher than the previous year’s peak. Interestingly, despite major events including the Super Bowl and March Madness, this year’s Q1 peak was reached on January 8th, during the College Football Playoff National Championship as Clemson took on Alabama.
Even more impressive than that single peak, the average daily peak was 76.1% higher than the same period last year, which illustrates that concurrent demand peaks are consistently higher. Notably, while this puts a significant strain on delivery services, quality metrics have continued to improve during this time period. This indicates that streaming TV providers and the industry ecosystem are keeping up with demand, even during the highest volume periods.
Growth among virtual multichannel video programming distributors (virtual MVPDs) like DirecTV Now, Hulu, PlayStation Vue, and Sling continues to outpace the field, said Conviva, with viewership up 107.7% as compared to 59.6% growth for other services in United States. Virtual MVPDs also continue to best other services in terms of quality, although the gap is closing slightly. Other services in the United States made significant improvements in video start time from 5.95 seconds in Q1 2018 to 4.28 seconds in Q1 2019 - in line with virtual MVPDs at 4.21 seconds. Nevertheless, virtual MVPDs continue to outperform other services when looking at other quality metrics including buffering at 0.26% as compared to 0.70%, picture quality 5.1 Mbps as compared to 4.5 Mbps, and video start failures at 0.68% as compared to 1.88%.
Conviva noted that virtual MVPDs focus on distributing content via connected TV with many offering free or discounted connected TV devices as part of their promotional offers. As would be expected, consumption for virtual MVPDs over-indexes on connected TV devices at 73.0% of all viewership as compared to 43.1% for other services in Q1 2019. While connected TV generally outperforms mobile and PC in terms of quality delivered, virtual MVPDs still outperformed other services even accounting for the additional viewership via virtual MVPDs on connected TV.
However, encouraging viewership on connected TV devices through promotions or further investment in connected TV applications may be beneficial for other streaming services as they focus on improving the viewer’s experience.
There are literally millions of potential issue combinations that can impact the quality of the viewer’s experience and require continued industry-wide infrastructure improvements, the research firm said. However, amidst skyrocketing demand, streaming providers have consistently delivered increasingly strong overall quality.
Among the quality metrics streaming TV providers and consumers care about most, buffering (when the video pauses during playback so it can reload) saw the largest improvement, down 33.9% year-over-year to 0.50%. Picture quality, as measured by bitrate, was also drastically improved 17.4% to 4.7 Mbps in Q1 2019. The rate of failures and start time both improved in Q1 2019 with 1.57% of videos failing to start representing an improvement of 34.8%, while time for the video to start decreased 7.8% to 4.2 seconds. Conviva has been measuring the quality trend for more than a decade, and it is clear consumers have become increasingly sophisticated and impatient. With billions of eyeballs up for grabs, improving viewer experience will continue to be critically important, Conviva concluded.