Comtech Announces Financial Results for Third Quarter of Fiscal 2025
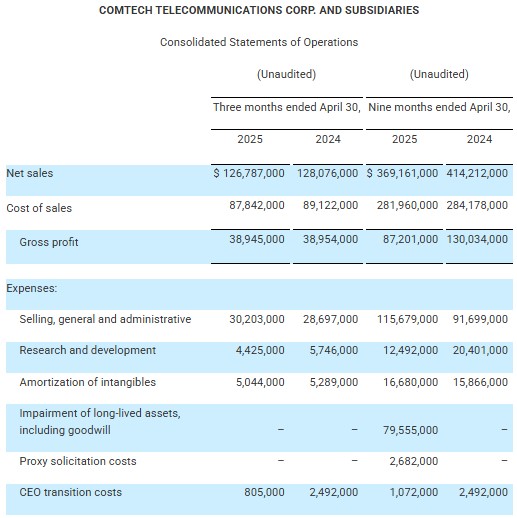
Chandler, Ariz., June 9, 2025 – Comtech Telecommunications Corp. (NASDAQ: CMTL) today reported financial results for its third quarter ended April 30, 2025. The company reported an Operating loss of US$ 1.5 million and net loss attributable to common shareholders of US $14.5 million on Net sales of US $126.8 million
Consolidated Financial Results, highlights (al amounts in US$)
- Net sales of $126.8 million
- Gross margin of 30.7%
- Operating loss of $1.5 million and net loss attributable to common shareholders of $14.5 million
- Adjusted EBITDA (a Non-GAAP measure) of $12.6 million, or 9.9%
- Net bookings of $71.0 million, representing a book-to-bill ratio of 0.56x (as described below, gross bookings during the third quarter were $107.4 million, representing a book-to-bill ratio of 0.85x)
- Funded backlog of $708.1 million and revenue visibility of approximately $1.2 billion
- GAAP cash flows provided by operations of $2.3 million
Ken Traub, Chairman, President and CEO, stated “We are pleased to report that our transformation plan is gaining traction and notable progress is already evident in our improved performance. In the third quarter, we secured a $40 million capital infusion that enabled us to re-negotiate terms with our senior secured lenders, which not only waived prior covenant breaches but also provided for more financial flexibility going forward. In addition, we have implemented measures to align accountability throughout the organization, improve operational efficiency, streamline our product lines, increase gross margins and reduce administrative costs. With a more targeted product-market focus, we have strengthened customer relationships and notched important new business wins. Nevertheless, we recognize Comtech has long-standing and lingering challenges, and while we have made significant progress, our transformation is still in the early innings. I am grateful to our entire dedicated team as well as all of our stakeholders for their loyalty, perseverance and contributions in helping us on the journey in building a strong, successful future for Comtech.”
Third Quarter Fiscal 2025 Consolidated Results
Consolidated net sales were $126.8 million in the third quarter, a decrease of 1.0% compared to the prior year period and an increase of 0.2% sequentially from last quarter. Net sales in the Terrestrial and Wireless Networks (“T&W”) segment were higher compared to the prior year period due to changes in products and services mix, including approximately $3.0 million of incremental NG-911 services revenue in the more recent period due to reaching an agreement with a statewide customer to retroactively invoice for certain recurring services provided in the past. Net sales in the Satellite and Space Communications (“S&S”) segment were lower compared to the prior year period due to decreased net sales of troposcatter solutions to the U.S. Marine Corps and U.S. Army, as both contracts wind down as anticipated. This was offset in part by higher net sales of SATCOM solutions, including VSAT and similar equipment sales to the U.S. Army and satellite ground infrastructure solutions.
Consolidated gross profit was $38.9 million, or 30.7% of consolidated net sales, in the third quarter, in line with the prior year period gross profit of $39.0 million, or 30.4%. The third quarter gross profit is a sequential increase from the $33.7 million, or 26.7%, reported in the immediately preceding quarter. The sequential improvement is primarily due to a more favorable sales mix and production efficiencies, as well as the inclusion of the incremental NG-911 services revenue discussed above in which most of the expenses were previously incurred.
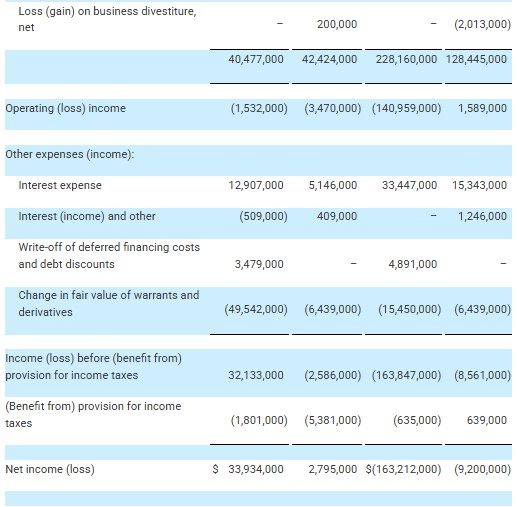
Consolidated operating loss was $1.5 million in the third quarter, compared to an operating loss of $3.5 million in the prior year period. Operating loss improvement from the prior year period is primarily the result of cost reduction initiatives which have reduced operating expenses. Operating loss in the third quarter significantly improved from the $10.3 million operating loss reported in the second quarter. The sequential improvement in the more recent quarter is due to the above improvements in gross profit and the benefit of cost reduction initiatives, lowering the Company’s overall operating expenses. Operating loss in the more recent period includes, among other things: $5.0 million of amortization of intangibles; $4.3 million of restructuring costs (mainly at the parent level); $1.2 million of amortization of stock-based compensation; and $0.8 million of CEO transition costs.
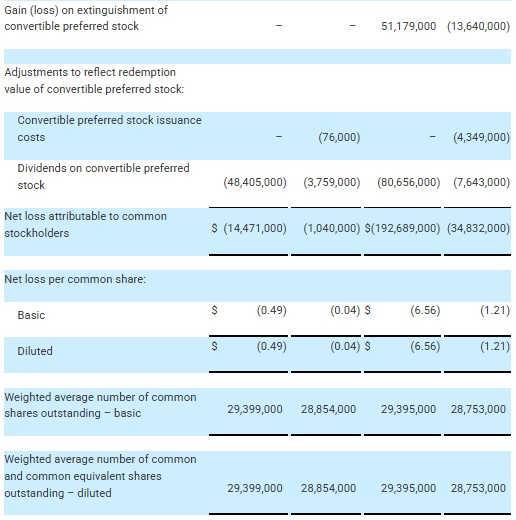
Consolidated net loss attributable to common shareholders was $14.5 million in the third quarter, compared to net loss attributable to common shareholders of $1.0 million in the prior year period and net loss attributable to common shareholders of $22.4 million in the immediately preceding quarter. In addition to those items discussed above, and as more fully discussed in the Company’s SEC filings, net loss attributable to common shareholders in the more recent period was impacted by higher interest expense, changes in the estimated fair values of derivatives and warrants, the write-off of deferred financing costs and debt discounts and accrued dividends related to the Company’s Convertible Preferred Stock.
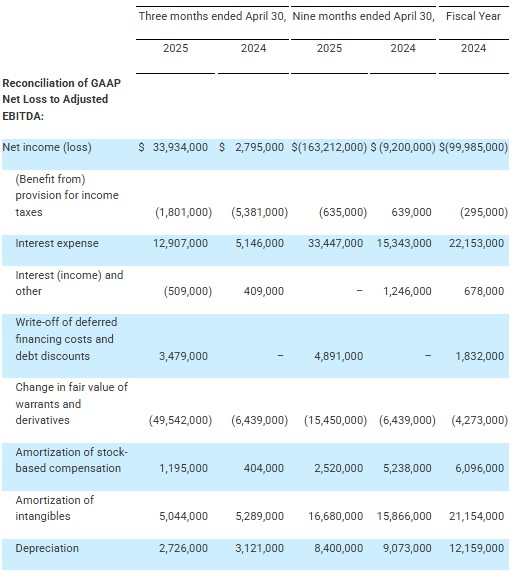
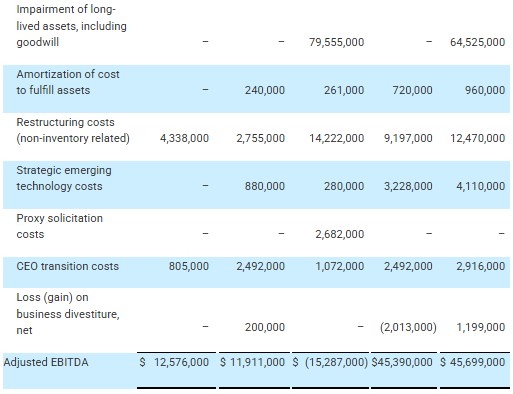
Consolidated Adjusted EBITDA (a non-GAAP measure) was $12.6 million in the third quarter, compared to Adjusted EBITDA of $11.9 million in the prior year period and Adjusted EBITDA of $2.9 million in the immediately preceding quarter. The improvements in Adjusted EBITDA are due to the factors and initiatives described above.
Consolidated net bookings were $71.0 million in the third quarter, a decrease of 30.2% and 10.5%, respectively, compared to the prior year period and immediately preceding quarter. The book-to-bill ratio in the more recent quarter was 0.56x. Consolidated net bookings reflect a $36.4 million debooking related to the low margin U.S. Army GFSR contract that was protested by and ultimately awarded to the incumbent in May 2025; gross bookings for the third quarter, excluding such debooking, were $107.4 million, an increase of 5.6% and 35.3%, respectively, compared to the prior year period and immediately preceding quarter, representing a quarterly book-to-bill ratio of 0.85x. The reduction in bookings reflects, in part, a more focused product positioning and sales approach.
Consolidated backlog was $708.1 million as of April 30, 2025, compared to $763.8 million as of January 31, 2025 and $798.9 million as of July 31, 2024. Revenue visibility, measured as the sum of funded backlog and the total unfunded value of certain multi-year contracts, was approximately $1.2 billion at the end of the third quarter.
GAAP cash flows from operations were $2.3 million in the third quarter, an improvement from both the prior year period’s cash outflows of $3.8 million and the prior quarter’s cash outflows of $0.2 million, and are due primarily to the combination of the improvements in GAAP operating performance, as described above, together with improved working capital management which includes progress toward completion of contracts that are accounted for over time (that previously led to high levels of unbilled accounts receivable), including related shipments, billings and collections from customers.
Satellite and Space Communications (S&S) Segment
S&S net sales were $67.6 million in the third quarter, a decrease of 5.3% compared to the prior year period and 8.3% sequentially from last quarter. Compared to the prior year period, S&S experienced lower net sales of troposcatter solutions to the U.S. Marine Corps and U.S. Army as those two contracts wind down as anticipated, offset in part by higher net sales of SATCOM solutions (including VSAT and similar equipment sales to the U.S. Army and satellite ground infrastructure solutions). Sequentially, S&S experienced lower net sales of troposcatter solutions to the U.S. Marine Corps and U.S. Army, offset in part by higher net sales of SATCOM solutions (primarily satellite ground infrastructure solutions).
The S&S segment is executing on initiatives to grow sales of next generation products, improve gross margins and reduce operating expenses. With recent strategic wins in digital satellite communication infrastructure, resilient communications programs and multi-orbit connectivity, the S&S segment is capitalizing on its differentiated technologies and extensive customer relationships to develop new vectors for growth.
As part of the Company’s commitment to improve operational discipline, Steve Black recently joined the S&S leadership team from General Dynamics as the new segment Chief Operating Officer reporting to Daniel Gizinski.
S&S operating income was $2.7 million in the third quarter, compared to operating income of $2.8 million in the prior year period and $1.2 million in the immediately preceding quarter. S&S operating income in the third quarter was impacted by $0.9 million of restructuring costs, compared to $0.6 million and $1.4 million, respectively, in the prior year period and immediately preceding quarter. The sequential increase in quarterly operating income primarily reflects lower selling, general and administrative expenses (due to cost reduction actions), partially offset by lower net sales and gross profit. These cost reductions represent the results of actions that have been implemented to rationalize product lines and streamline the organization, which in addition to generating cost savings, have helped to improve accountability at the site level and enhance focus on priority products, production and customer commitments.
S&S net income was $2.9 million for the third quarter, compared to a net income of $1.8 million in the prior year period and $1.6 million in the immediately preceding quarter.
S&S Adjusted EBITDA was $5.7 million in the third quarter, compared to Adjusted EBITDA of $7.2 million in the prior year period and $4.7 million in the immediately preceding quarter. Compared to the prior year period, Adjusted EBITDA reflects lower net sales and gross profit (both in dollars and as a percentage of related segment net sales), offset in part by lower selling, general and administrative expenses and research and development expenses. The sequential increase in Adjusted EBITDA primarily reflects lower selling, general and administrative expenses, offset in part by lower net sales and gross profit.
S&S book-to-bill ratio for the third quarter was 0.26x. Excluding the aforementioned $36.4 million debooking associated with the U.S. Army GFSR contract, the segment’s book-to-bill ratio was 0.80x. This ratio compares to 0.85x in the prior year period and 0.64x in the second quarter. The reduction in bookings reflects, in part, a more focused product positioning and sales approach.
Key S&S contract awards and product milestones during the third quarter included:
- Completed initial deliveries of next generation VSAT systems to a strategically significant allied Navy partner, an important step for a comprehensive fleet modernization program that includes ships, submarines and ground-based stations – deliveries are expected to continue over a two-year period;
- $8.5 million in aggregate orders from three commercial customers for high-power amplifiers and frequency converters for use in airborne related applications;
- Incremental funding of approximately $6.8 million for continued, ongoing training and support of complex cybersecurity operations for U.S. government customers;
- Additional funding of approximately $5.8 million from a major U.S. prime contractor in support of NASA’s Orion Production and Operations Contract (“OPOC”), commonly known as the Artemis project;
- Approximately $5.0 million in funded orders from a long-time international customer for the procurement of ongoing maintenance and support services related to long-range missile and rocket launch tracking systems; and
- In excess of $3.6 million in funded orders calling for the supply of VSAT equipment and related services for the U.S. Army.
Terrestrial & Wireless Networks (T&W) Segment
T&W net sales were $59.2 million in the third quarter, an increase of 4.6% and 12.0%, respectively, compared to the prior year period and immediately preceding quarter. Compared to the prior year period, as well as sequentially, T&W experienced higher net sales of next-generation 911 (“NG-911”) services and location-based solutions, offset in part by lower net sales of call handling solutions. Third quarter net sales and gross profit benefited from approximately $3.0 million of incremental NG-911 services revenue due to reaching an agreement with a statewide customer to retroactively invoice for certain recurring services provided in the past. Key growth drivers for the T&W segment are expected to include customer upgrades to next-generation core services, new cloud-based emergency response products and increasing interest from international carriers for 5G location technologies.
T&W operating income was $8.4 million in the third quarter, compared to operating income of $5.7 million in the prior year period and operating income of $3.4 million in the immediately preceding quarter. Compared to the prior year period, as well as sequentially, the increase in quarterly operating income primarily reflects higher net sales and gross profit, both in dollars and as a percentage of related segment net sales and including the NG-911 services revenue discussed above in which most of the expenses were previously incurred, offset in part by higher selling, general and administrative expenses and research and development expenses.
T&W net income was $8.6 million in the third quarter, compared to net income of $5.3 million in the prior year period and $3.4 million in the immediately preceding quarter.
T&W Adjusted EBITDA was $13.9 million in the third quarter, compared to Adjusted EBITDA of $11.3 million in the prior year period and $8.9 million in the immediately preceding quarter. Compared to the prior year period, as well as sequentially, Adjusted EBITDA reflects those factors discussed above.
T&W book-to-bill ratio in the third quarter was 0.91x, compared to 0.72x in the prior year period and 0.61x in the second quarter.
Key T&W contract awards and product milestones during the third quarter included:
- A new contract, valued at over $27.0 million during the initial five-year term, for statewide NG-911 services for a Southeastern state;
- Various funded orders totaling $9.0 million for wireless location-based messaging services;
- Over $2.5 million of initial funding from a new international customer for location-based messaging services;
- More than $2.5 million of incremental funding for an existing NG-911 customer in a Midwestern state;
- Various funded orders, aggregating $1.4 million, primarily for location and maintenance and support services for a large wireless carrier in the U.S.; and
- Additional funding from a Mid-Atlantic state for ancillary network and call handling services.
Additionally, T&W announced that it is nearing the completion of the development of its latest NG-911 call handling solution, which features a new architecture leveraging cloud and AI capabilities and designed to serve first responders in the U.S., Canada and Australia even better. The Company anticipates launching its revolutionary new product at this year’s upcoming National Emergency Number Association (“NENA”) conference.
Cost-Savings and Profit Improvement Initiatives
Comtech continues to execute on its transformation plan which includes a thorough review of processes, product lines, staffing levels and cost structures to implement actions to reduce costs, enable a more efficient and effective organization and improve the Company’s cash conversion cycle. Comtech has ceased manufacturing operations in the U.K. More than 70 products within the S&S segment have been discontinued, and the Company is completing the final deliveries of outstanding orders for these discontinued products over the next few months. Further, the Company has reduced its global workforce by approximately 15% since July 31, 2024, which represents approximately $33.0 million in annualized labor costs. Over the course of the nine months ended April 30, 2025, severance associated with such actions approximated $2.7 million (primarily within selling, general and administrative expenses). The Company continues to evaluate additional opportunities to improve operational efficiency, reduce costs and improve profitability.
While the Company continues to invest in R&D, it is obtaining customer funding for research and development to adapt its products to specialized customer requirements. During the third quarter, customers reimbursed the Company $5.9 million in connection with R&D efforts. Such amount is in addition to the $4.4 million of Comtech funded R&D reported in the third quarter of fiscal 2025. This customer-funded R&D not only offsets the Company’s expenditures, but helps to ensure that R&D expenditures are aligned with customer and market demand.
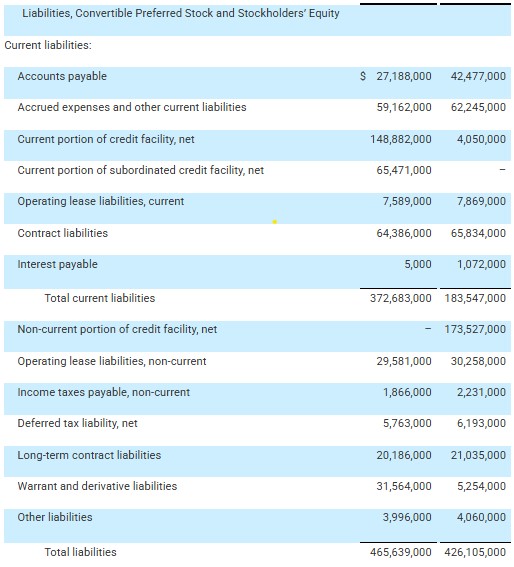
Capital Structure and Liquidity
As previously disclosed on March 3, 2025, the Company amended its Credit Facility and Subordinated Credit Facility to, among other things, waive existing breaches under the facilities, and suspend testing of the Net Leverage Ratio and Fixed Charge Coverage Ratio covenants until the quarter ending on October 31, 2025.
As of June 6, 2025, Comtech’s available sources of liquidity approximate $27.3 million, consisting of qualified cash and cash equivalents and the remaining available portion of the committed Revolver Loan.
At both April 30, 2025 and June 6, 2025, total outstanding borrowings under the Credit Facility were $168.0 million, including $23.4 million drawn on the Revolver Loan.
As of April 30, 2025, total outstanding borrowings under the Amended Subordinated Credit Facility were $65.0 million (excluding accreted interest and make whole adjustments), and the liquidation preference of the Company’s outstanding convertible preferred stock was $199.7 million (excluding potential increases in the liquidation preference and other obligations that could be triggered by, among other things, breaches of covenants, asset sales and/or change in control of the Company).
 |
 |
 |
 |
 |
 |
|
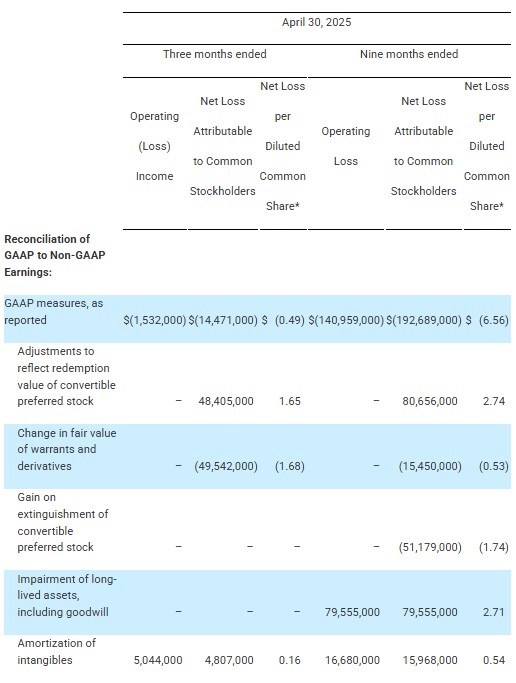
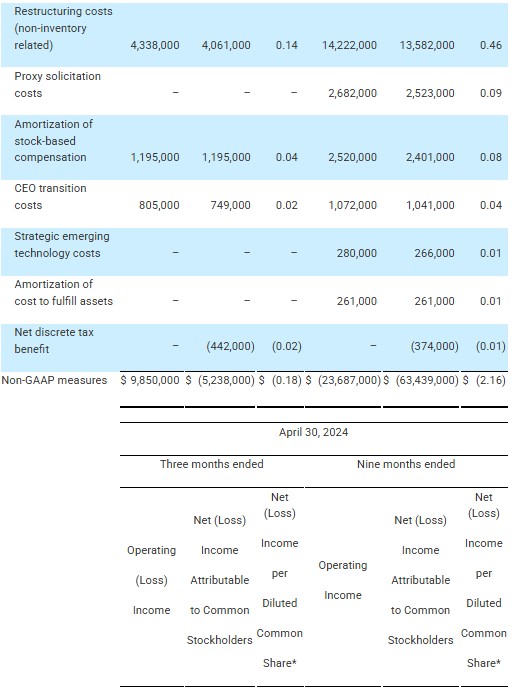
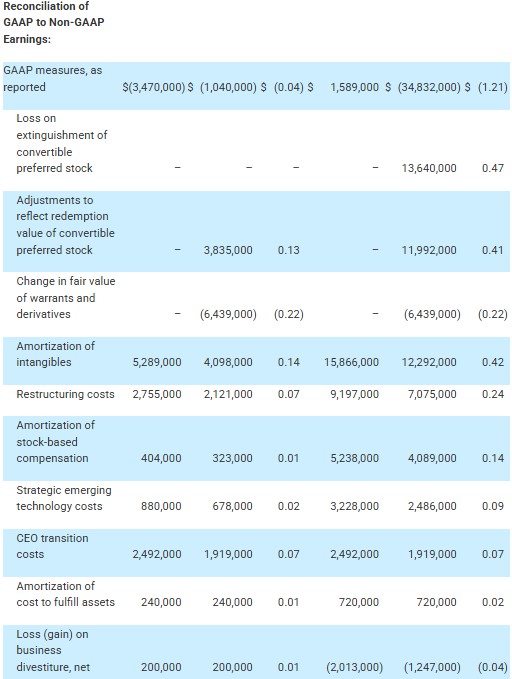
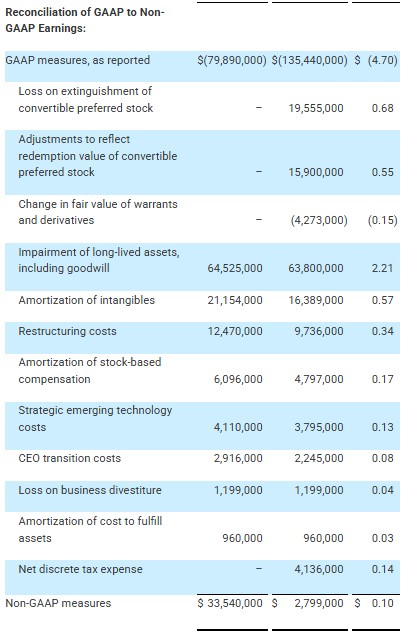
Use of Non-GAAP Financial Measures To provide investors with additional information regarding the Company’s financial results, this release contains “Non-GAAP financial measures” under the rules of the SEC. The Company’s Adjusted EBITDA is a Non-GAAP measure that represents earnings (loss) before interest, income taxes, depreciation, amortization of intangibles, impairment of long-lived assets, including goodwill, amortization of cost to fulfill assets, amortization of stock-based compensation, CEO transition costs, change in fair value of warrants and derivatives, proxy solicitation costs, restructuring costs (non-inventory related), strategic emerging technology costs (for next-generation satellite technology), and write-off of deferred financing costs and debt discounts, and in the recent past, acquisition plan expenses, change in fair value of the convertible preferred stock purchase option liability, COVID-19 related costs, facility exit costs, strategic alternatives expenses and other and loss on business divestiture. These items, while periodically affecting its results, may vary significantly from period to period and may have a disproportionate effect in a given period, thereby affecting the comparability of results. Although closely aligned, the Company’s definition of Adjusted EBITDA is different than EBITDA (as such term is defined in its Credit Facility) utilized for financial covenant calculations and also may differ from the definition of EBITDA or Adjusted EBITDA used by other companies and therefore may not be comparable to similarly titled measures used by other companies. Adjusted EBITDA is also a measure frequently requested by its investors and analysts. The Company believes that investors and analysts may use Adjusted EBITDA, along with other information contained in its SEC filings, including GAAP measures, in assessing performance and comparability of results with other companies. Non-GAAP measures reflect the GAAP measures as reported, adjusted for certain items as described herein and also excludes the effects of the Company’s outstanding convertible preferred stock. These Non-GAAP financial measures have limitations as an analytical tool as they exclude the financial impact of transactions necessary to conduct its business, such as the granting of equity compensation awards, and are not intended to be an alternative to financial measures prepared in accordance with GAAP. These measures are adjusted as described in the reconciliation of GAAP to Non-GAAP measures in the tables presented herein, but these adjustments should not be construed as an inference that all of these adjustments or costs are unusual, infrequent or non-recurring. Non-GAAP financial measures should be considered in addition to, and not as a substitute for or superior to, financial measures determined in accordance with GAAP. Investors are advised to carefully review the GAAP financial results that are disclosed in the Company’s SEC filings. As the Company has not provided future financial targets, there is no need to reconcile its business outlook to the most directly comparable GAAP measures. Furthermore, even if targets had been provided, items such as stock-based compensation, adjustments to the provision for income taxes, amortization of intangibles and interest expense, which are specific items that impact these measures, have not yet occurred, are out of the Company’s control, or cannot be predicted. For example, quantification of stock-based compensation expense requires inputs such as the number of shares granted and market price that are not currently ascertainable. Accordingly, reconciliations to the Non-GAAP forward looking metrics would not be available without unreasonable effort and such unavailable reconciling items could significantly impact the Company’s financial results. |
 |
 |
 |
 |
 |
 |
 |
|
* Per share amounts may not foot due to rounding. In addition, due to the GAAP net loss for the period, Non-GAAP EPS for the three and nine months ended April 30, 2024 and fiscal 2024 was computed using weighted average diluted shares outstanding of 28,936,000, 28,948,000 and 29,132,000, during the respective period. |